


By Dewi John, head of research at LSEG Lipper
How have global fund flows responded to the seesawing moves of capital markets in the first five months of the year? The most popular asset class by fund has been money market ($238.2bn). Some $267.4bn has gone into Money Market USD funds (primarily to US-domiciled funds), with $54.5bn to their euro equivalents.
However, despite persistent market jitters, equities are still strongly in positive territory ($143.7bn), as are bonds ($120bn).
At a more granular level, US equities are still in positive territory — indeed, at $192.9bn, they have attracted more than for equities as a whole. While, at the time of writing, the S&P 500 is still below its February all-time high, it has recovered from early April’s nosedive. April’s Equity US flows were $43.8bn — the second highest month for the year.
On the other hand, the US equity pain is being felt by blue chip’s smaller siblings, as Equity US Small & Mid Cap has suffered $62.5bn of redemptions, the worst month being April (-$20.1bn). This is unsurprising, given that they are generally viewed as higher risk, and potentially more exposed to tariff risk, and likely has further to go should uncertainty persist.
Chart 1: Select classification glows, global, Jan-May 2025 (US$bn)
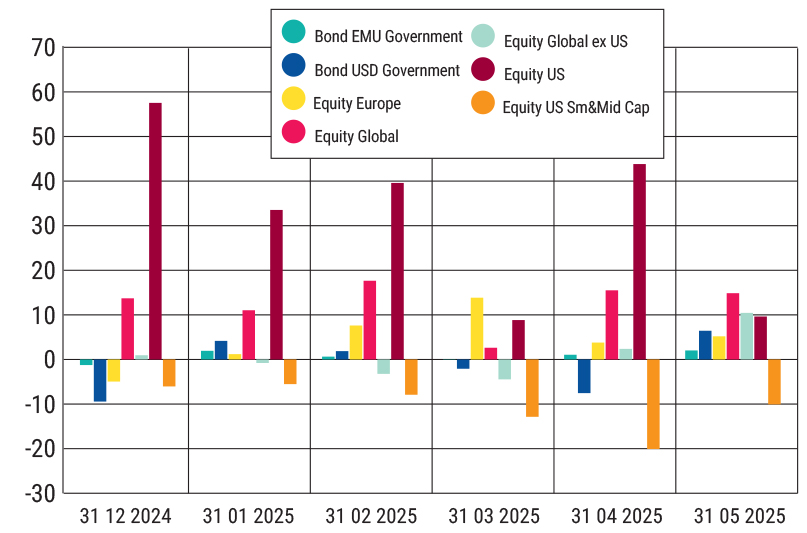
Equity Global funds are the “spread your bets” option, and were the default one for the asset class before the US-exceptionalism story became the dominant market narrative. Flows here have stayed fairly consistent over the year — between £11bn and $18bn — except for March, when flows for the classifications were well down (chart 1). However, Equity Global ex US fund flows have trended up over April and May, which may be a sign of some investors cutting their US exposure.
View from the States
Separating out funds domiciled in the US from those outside gives a different picture. Chart 2 shows flows for the same classifications, excluding Bond EMU Government.
Chart 2: Select classification flows, US-domicile, Jan-May 2025 (US$bn)
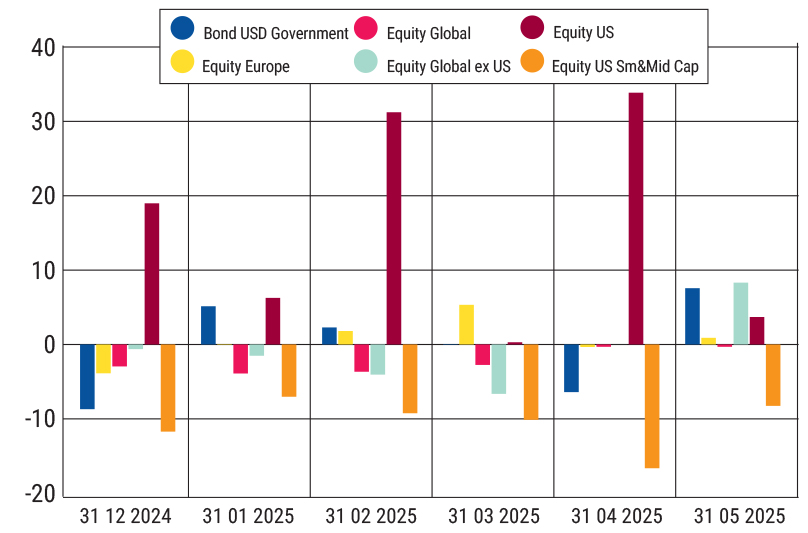
Allocations to US-domiciled Equity US funds month by month have been quite volatile, with the largest being April, after an anaemic March. But demand has nevertheless broadly trended upwards, except for May —although the caveat here is that the month’s figures are provisional until mid-June, and I’m typing this early in the month, so open to change. That proviso in mind, the spike in May Equity Global ex-US inflows in May ($8.3bn) is unusual, and may indicate some US investors diluting their domestic exposure.
They have certainly not been doing it by buying Equity Global funds, which have seen outflows each month (totalling -$13.9bn by the end of May). This is a differentiator with non-US domiciled fund investors, who have allocated $89.3bn to the classification over the course of the year, as their flows to Equity US funds have slowed (chart 3) despite being in positive territory throughout. Equity Europe flows have trended upwards, peaking in March.
… and everywhere else
Meanwhile, for non-US-domiciled funds, Equity Global—still with 60%+ exposure to US equities—have increased relative to Equity US, exceeding the latter in April/May. It’s also interesting that Equity Global ex US flows have increased, as has been the case for their US-domiciled counterparts.
Chart 3: Select classification flows, non-US-domicile, Jan-May 2025 (US$bn)
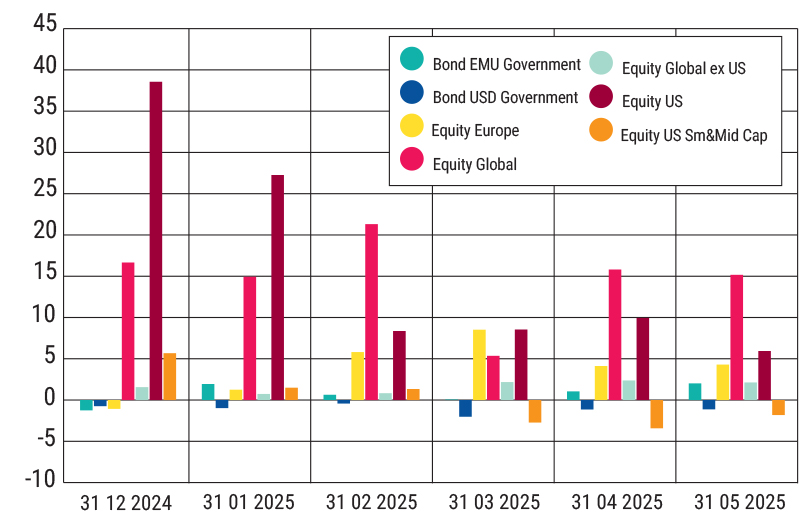
Given the outperformance of European equities over the first four months of the year, it’s not terribly surprising to see Equity Europe shift from outflows to in- from the start of the year, with these non-US domiciled funds taking $24bn from February to May. While late April and May’s “relief rally” saw US equities recover, volatility and geopolitical uncertainty may well see a continuation of this trend.
Lastly, for non-US investors, Bond USD Government funds have seen outflows each month. The perceived heightened risk and weaker USD would likely inform this. That said, the $6.6bn of YTD redemptions, largely from non-US investors, seems quite modest. Adding a further codicil to this, although the total size of the US Treasury market is not far off $30trn, less than 12% of this is held within mutual funds and ETFs.
To paraphrase Paul Simon, there must be 50 ways to dump your T-bills. Nevertheless, that $6.6bn still represents about 2% of the market.
The story so far seems to be that there is no rush to the exit on US assets — small- and mid-caps excepting — although non-US investors are feeling their way around for alternatives should the magnificent seven definitively lose their magnificence and become more akin to the 1995 Brad Pitt/Morgan Freeman film.