By Dewi John, head of research, UK and Ireland at LSEG Lipper
Google small-cap performance and you’ll find a bunch of sponsored links from small-cap fund managers telling you that this corner of the market is at a historically low discount to large caps and now is the time to buy. Compelling stuff — we all love a bargain.
Less prominent are pieces on the impediments small caps continue to face, but we’ll come to that later.
Those tempting discounts exist, of course, because of small-cap underperformance. So, a lot hinges the persistence of this effect — or to put it another way — where has the small-cap premium gone, and when will it be back? Researching this piece, I read one headline that announced “small caps won’t underperform forever”. That’s great. But forever is a really long time. It’s longer even than the long run, when I’m reliably informed that we will all be dead.
This piece looks at how small- and large-cap funds have performed in different macro-economic conditions over three markets so far this century.
It works in theory
Much of the appeal to authority in the small-cap space comes from a 1992 paper, The Cross-Section of Expected Stock Returns, by Eugene Fama and Kenneth French, who went on to win Nobel Prizes. If you’ve ever sat through a small-cap fund pitch, you will almost certainly have come across this work. Its “main result is that two easily measured variables, size and book-to-market equity, seem to describe the cross-section of average stock returns”. In other words, smaller company equities tend to outperform larger ones.
Why hasn’t this delivered? Well, first, it has been argued that market structure has changed over the past 30-plus years: there are fewer listed companies, and far fewer small-cap listed ones. When they do IPO, they tend to be considerably older than was the case at the start of the century, with more mature growth profiles. So it’s possible that investors in small-cap listed equities are missing some of that early stage juice.
Another possibility is that as M&A activity has massively increased over the period, large caps are buying in their growth by absorbing innovative small caps, often before they’ve had the opportunity to list.
One differentiator at the fund level is cost. For example, small-cap investors generally face the issue of higher fund charges relative to their large-cap peers. That’s the case with the UK (with total expense ratios of 1.18% large cap to 1.31% small) and US (1.19%/1.51%), although not Global (1.32%/1.31%). The latter may be impacted by a higher proportion of passives among large-cap funds. Suffice it to say, the impact of charges will obviously have an incrementally greater impact on returns—but that will be the case irrespective of market environment.
Our survey says…
The analysis below looks at the performance of three equity geographies — global, US, and UK — contrasting small and large cap, as defined by Lipper’s classifications. Therefore, we are looking at funds not indices. Funds, still dominated by active management, will naturally diverge from the broad indices that represent their markets, and it’s the former on which this analysis is based.
I divided the nearly 25-year period into three distinct economic environments: 2000 to 2008, 2009 to 2021, and 2022 to July 2024. The first period covers both the global financial crisis and the dotcom bust. Hence the relative paucity of returns: exclude 2000 or 2008, and the return profile looks rather different. But we all would retrospectively exclude those periods of crushing underperformance if only we could.


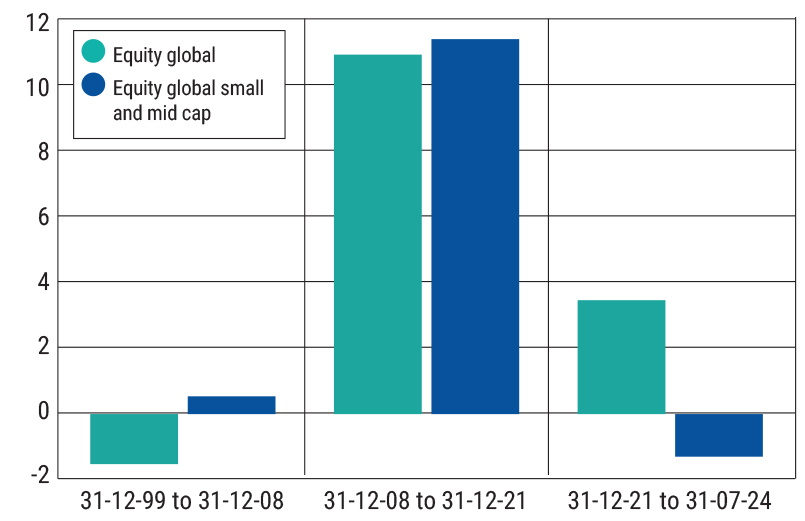
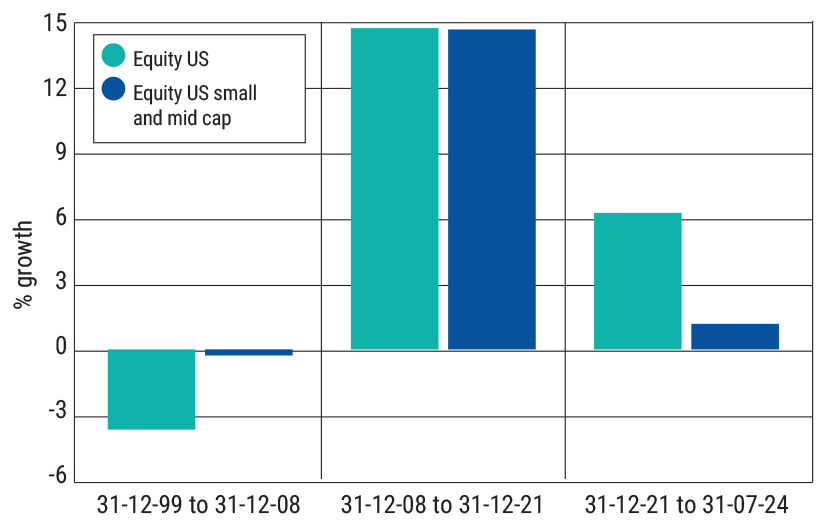
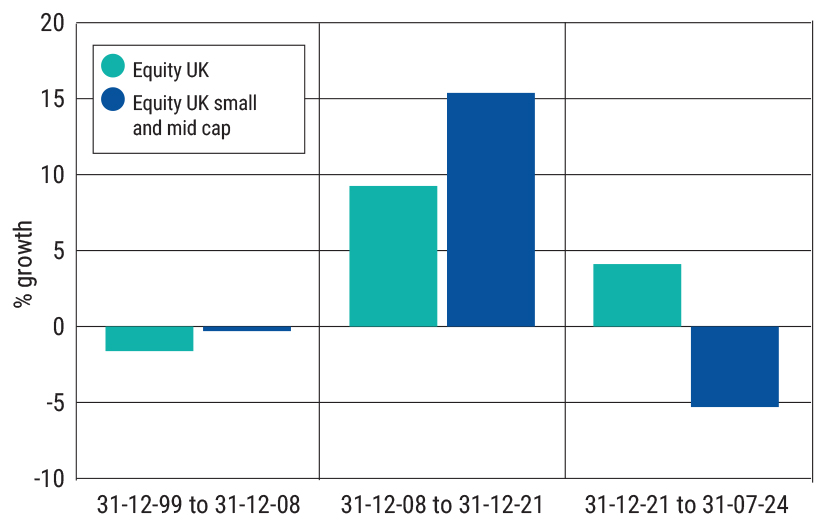
These caveats accepted, what does the data show? Between 2000 and 2008, global, UK, and US small caps outperform their large-cap equivalents, despite the period encompassing two major crashes and the greater sensitivity of small caps to such events.
The second period (2009 to 2021) is also rather interesting, as global small and mid caps outperform by an annualised 48 basis points (bps), US Smids underperform by a wafer-thin six bps, while UK Smids massively outperform by 6.13 percentage points. This, remember, is the period where the market was enthralled by BATs, FAANGs, and other vampire-themed stocks. While they certainly stamped their character on the markets, they were not the only game in town. The UK obviously lacks such tech meme stocks, but even in the US, large caps weren’t streets ahead.
Things, though, are unambiguous from 2022 to July 2024. Here, large-cap annualised outperformance in percentage points is: global, 4.85; US, 5.16; and UK, 9.41. That UK figure is all the more remarkable because the UK doesn’t have any of those shiny tech and AI-themed mega caps. So there is more going on than just the market being in thrall to AI-exposed mega caps. The difference is more down to the small-cap falls (at -5.3% a year—way more than their global or US peers).
I’ve mused on UK small caps back in March, so I won’t reprise it here. Suffice it to say, the UK Smid market has been particularly stressed as large asset owners have been reducing their UK equity exposure for the past two decades and exacerbating outflows, generating a negative feedback loop of de-ratings and outflows that has been particularly fed lower down the cap scale.
More generally, across all three geographies, one reason for this small-cap underperformance is that they tend to be more highly leveraged, which will be punitive in a higher-rate environment. This may mean that rates heading down catalyses a small-cap rebound. But, as the different return profiles above indicate, there’s always a lot more going on in markets than can be summed up in one single signal.


