In December, Last Word Research commented on the rise in popularity of ESG investing and the impact Greta Thunberg is having on the financial industry. This month, we look at the relationship between funds rated by Morningstar as ‘high’ for their ESG credentials, and those expected to have the best future performance among their peers. Funds that sit at the top of this forward-looking ranking are awarded ‘gold’.
The table below shows all UK-domiciled funds ranked gold under this system. It is clear that, despite the expectation these funds will outperform their benchmarks in the upcoming months, few are also rated ‘high’ in the Morningstar sustainability tables, with the majority labelled as ‘average’.
| All UK-domiciled funds with a “Gold” Morningstar Analyst Rating | Fund Size (£bn) | Morningstar Sustainability Rating |
| Fundsmith Equity I Acc | 19.65 | Above Average |
| Vanguard FTSE U.K. All Shr Idx UT Acc | 10.77 | Average |
| Vanguard LifeStrategy 60% Equity A Acc | 7.86 | Average |
| Vanguard US Equity Index Acc | 7.58 | Below Average |
| Vanguard US 500 Stock Index Ins USD Acc | 6.08 | Average |
| iShares North American Eq Idx (UK) L Acc | 5.47 | Average |
| HSBC American Index Retail Acc | 5.35 | Average |
| Capital Group New Pers (LUX) ZL | 4.76 | Average |
| Comgest Growth Emerging Mkts USD Acc | 4.36 | High |
| L&G US Index R Acc | 3.98 | Average |
| JPM US Equity Income A Net Acc | 3.81 | Average |
| Fundsmith Equity Sicav I EUR Acc | 3.73 | Above Average |
| Vanguard LifeStrategy 80% Equity A Acc | 3.72 | Average |
| Dodge & Cox Worldwide Global Stk USD Acc | 3.65 | Low |
| Schroder ISF Asian Ttl Ret I Acc USD | 3.38 | Average |
| Comgest Growth Europe EUR Acc | 3.06 | High |
| iShares Glb Prpty Secs Eq Idx (UK) L Acc | 2.84 | Average |
| Dodge & Cox Worldwide US Stock A USD | 2.34 | Above Average |
| Fidelity Index US A Acc | 1.97 | Average |
| Man GLG Japan CoreAlpha Profl Acc C | 1.90 | Below Average |
| ASI UK Smaller Companies I Acc | 1.87 | Below Average |
| iShares Japan Equity Index (UK) L Acc | 1.83 | Average |
| Man GLG Jpn CoreAlpha Eq I JPY | 1.75 | Below Average |
| HSBC GIF Euro High Yield Bond AD | 1.71 | Average |
| Uni-Global Equities Europe SA-EUR | 1.69 | Above Average |
| iShares Dev Rl Ett Idx (IE) Instl Dis € | 1.55 | Average |
| Barings Europe Select A GBP Inc | 1.54 | Above Average |
| HSBC Japan Index Retail Inc | 1.49 | Average |
| Schroder ISF Greater China C Acc USD | 1.14 | Above Average |
| Schroder European I GBP Acc | 1.02 | Average |
| Schroder ISF Asian Eq Yld C Acc USD | 0.90 | Average |
| First State Asia Focus B Acc GBP | 0.89 | Average |
| Schroder ISF China Opps C Acc USD | 0.81 | Average |
| T. Rowe Price US Blue Chip Eq A USD | 0.81 | Below Average |
| Dimensional UK Core Equity GBP Acc | 0.80 | Average |
| JPM ASEAN Equity A (acc) USD | 0.71 | Above Average |
| Capital Group Global Allc (LUX) Z | 0.57 | Above Average |
| First State Greater China Gr B Acc GBP | 0.53 | Above Average |
| MFS Inv Global Concentrated Equity USD | 0.42 | High |
| Capital Group New World (LUX) Z | 0.30 | Average |
| Schroder ISF Taiwanese Equity C Acc USD | 0.23 | High |
| Dimensional US Sm Company B EUR | 0.15 | Below Average |
| First State Hong Kong Growth III USD Acc | 0.12 | Average |
| Uni-Global Equities Eurozone SA-EUR | 0.10 | High |
| Capital Group AMCAP (LUX) Z | 0.08 | Below Average |
Source: Morningstar
Aiming high
Why does this matter? Investors may want to focus on a fund’s performance rather than its ESG compatibility. If this is the case, you would think they would rely just on the Morningstar analyst rating to select their next fund.
However, a recent Last Word Research study shows funds that complied with ESG challenges, and had a Morningstar sustainability rating of ‘high’, significantly outpaced those marked as ‘low’ or ‘below average’ for net fund flows, and therefore sales.
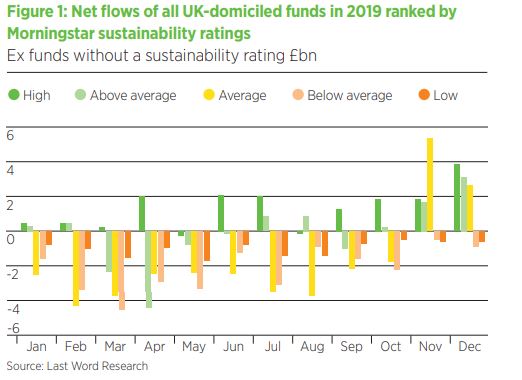
The figure below shows net flows for all UK-domiciled funds with a Morningstar sustainability rating. In every month there were net inflows into funds ranked ‘high’, which from January to December totalled £23bn. For funds marked ‘low’ there were net outflows of £15bn during the same time period.
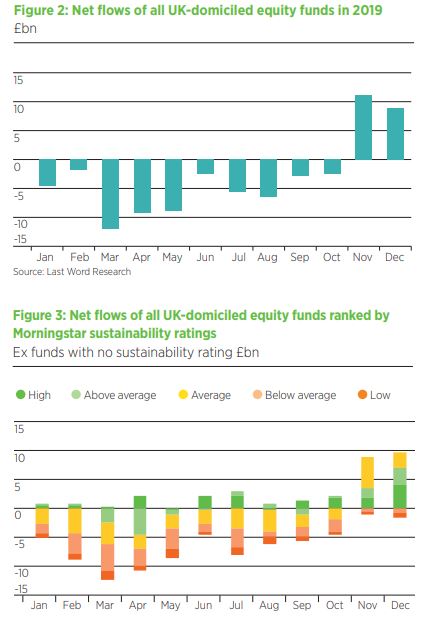
To paint a clearer picture, figure 2 below shows net flows for all UK equity funds in 2019, which includes those with and without Morningstar sustainability ratings. As you can see, it has been a tough year for the asset class, with a whopping £57bn net outflows between January and October 2019.
Marked down
If net flows for funds within this asset class are divided up by their Morningstar sustainability ratings, as in figure 3 above, those ranked ‘high’ fared much better than their lower-ranked peers when it came to net flows.
Even during the period of significant outflows from UK equities (January-October 2019), there were net inflows totalling £10bn into funds Morningstar ranked ‘high’.
Every quarter, Last Word Research produces an asset allocation report that provides a snapshot of the forward-looking investment sentiments of some of the biggest UK fund selectors.
The last round of data was collected in November and December 2019, and it was clear that appetite for buying UK equities has not just reversed course but increased substantially. Despite this, funds with a Morningstar sustainability rating of ‘below average’ or ‘low’ by were hit by further net outflows during this time.
During the past year, a trend has emerged in which funds deemed highly ESG-compliant are in aggregate beating their lower-ranked peers when it comes to net flows.
Going for gold
Why does Morningstar fail to take this into account when compiling its Morningstar analyst ratings? The table below shows all UK-domiciled funds that received a ‘high’ sustainability ranking, yet only five of these also have a ‘gold’ analyst rating.
Though strict compliance to ESG criteria does not guarantee improved future performance, or beating the benchmark, appetite for investing in ESG funds is clearly increasing, and more money has flown into funds that are highly ESG compliant.
When it comes to its analyst ratings, Morningstar may need to start considering ESG compliance or, at the very least, attach greater importance to such factors.
| All UK-domiciled funds with a “High” Morningstar Sustainability Rating | Fund Size (£bn) | Morningstar Analyst Rating |
| Lindsell Train Global Equity B GBP Inc | 8.40 | Silver |
| UBS (Lux) EF China Oppo(USD) P USD acc | 7.53 | Silver |
| JPM Emerging Markets Equity A (dist) USD | 6.69 | Silver |
| LF Lindsell Train UK Equity Acc | 6.66 | Bronze |
| Fidelity Global Dividend I-Acc-EUR | 6.37 | Bronze |
| Allianz Europe Equity Growth W EUR | 5.31 | Bronze |
| Comgest Growth Emerging Mkts USD Acc | 4.36 | Gold |
| JPM Japan Equity A (dist) USD | 3.86 | Bronze |
| Fidelity European Dynamic Gr A-Dis-EUR | 3.52 | Silver |
| Merian UK Mid Cap A GBP Acc | 3.49 | Bronze |
| Comgest Growth Europe EUR Acc | 3.06 | Gold |
| Robeco Global Consumer Trends Eqs D € | 2.71 | Silver |
| Allianz Euroland Equity Growth W EUR | 2.66 | Neutral |
| MFS Meridian Prudent Wealth I1 USD | 2.63 | Silver |
| Vontobel Emerging Markets Eq A USD | 2.41 | Bronze |
| BNY Mellon Mlt-Asst Balanced GBP Inc | 2.14 | Bronze |
| T. Rowe Price EM Eq I USD | 2.07 | Bronze |
| JPM Emerging Markets C Net Acc | 1.99 | Silver |
| BNY Mellon Mlt-Asst Growth GBP Inc | 1.66 | Neutral |
| Threadneedle European Sel Ins Acc GBP | 1.66 | Bronze |
| Franklin UK Mid Cap A Inc | 1.39 | Silver |
| Fidelity Global Dividend A ACC | 1.39 | Bronze |
| MFS Meridian Prudent Capital I1 USD | 1.29 | Silver |
| AS SICAV I Indian Equity A Acc GBP | 1.29 | Bronze |
| JPM Japan A Net Acc | 1.21 | Bronze |
| Royal London Sustainable Div C Inc | 1.20 | Bronze |
| GuardCap Global Equity I USD Acc | 1.11 | Silver |
| Stt Strt EUR Sust Corp Bd Idx I EUR Inc | 1.10 | Bronze |
| Royal London Sustainable Leaders A Inc | 1.06 | Bronze |
| Royal London Sustainable World A Inc | 1.04 | Bronze |
| L&G Sterling Corporate Bond Index I Acc | 1.01 | Neutral |
| MFS Meridian Global Concntr B1 USD | 0.90 | Silver |
| JPM Pacific Equity A (dist) USD | 0.86 | Silver |
| RobecoSAM Smart Energy B EUR | 0.79 | Bronze |
| Allianz Europe Equity Gr Sel W EUR | 0.62 | Bronze |
| Heptagon Yacktman US Equity C USD Acc | 0.60 | Silver |
| Kames Ethical Equity GBP B Acc | 0.58 | Bronze |
| JPMorgan India (acc) – USD | 0.57 | Bronze |
| JPM Greater China A (dist) USD | 0.56 | Bronze |
| Jupiter Ecology | 0.54 | Neutral |
| BlackRock UK D Acc | 0.53 | Bronze |
| JPM India A (dist) USD | 0.53 | Bronze |
| Kames Ethical Cautious Managed GBP A Acc | 0.43 | Bronze |
| MFS Inv Global Concentrated Equity USD | 0.42 | Gold |
| Vontobel Asia Pacific Equity A USD | 0.41 | Bronze |
| Comgest Growth Eurp Smlr Coms EUR Acc | 0.41 | Silver |
| MFS Meridian US Concentrated Gr B1 USD | 0.38 | Neutral |
| ASI UK Ethical Equity R Acc | 0.38 | Bronze |
| MI Somerset Global Emerg Mkts B Acc | 0.33 | Bronze |
| Stewart Inv Indian Sbctnt Sustnby A GBP | 0.29 | Bronze |
| Comgest Growth China EUR Acc | 0.27 | Bronze |
| GAM Multistock Luxury Brands Eq USD C | 0.25 | Neutral |
| Schroder ISF Taiwanese Equity C Acc USD | 0.23 | Gold |
| BBH Lux Core Select I | 0.19 | Bronze |
| Legg Mason IF Royce US Smlr Coms A Acc | 0.19 | Neutral |
| Artemis Global Select I Acc | 0.18 | Silver |
| BGF United Kingdom A2 | 0.18 | Neutral |
| First State Japan Equity III USD Acc | 0.15 | Neutral |
| Manulife Glbl Qual Gr(Ex-US) I USD Acc | 0.11 | Bronze |
| Uni-Global Equities Eurozone SA-EUR | 0.10 | Gold |
| Comgest Growth GEM Promis Coms EUR Acc | 0.08 | Bronze |
| Legg Mason RY US Smlr Coms C USD Dis(A) | 0.06 | Neutral |
| Uni-Global Equities Japan SA-JPY | 0.06 | Silver |
Source: Morningstar
This article was written by Lottie McGurk, a quantitative researcher at Last Word Research
If you wish to see the full results of our research, or discuss any of this further, please contact lottie.mcgurk@lastwordmedia.com

