

By Mamdouh Medhat, PhD, senior researcher at Dimensional Fund Advisors
Equity markets are notoriously volatile. The path to the long-term average return is far from a straight line. This applies to the performance of equities as a whole as well as to the premiums within equities. So, if you have read this year that the market has rotated from growth to value, or value to growth, it’s best to think of that as the market doing what it does, rather than as a signal that you should do something different with your asset allocation.
The chart below illustrates the volatility of value in more detail. It shows the annual value premium in the US market since 1927, ranked from worst to best. The long-term average value premium (as indicated by the horizontal dotted line) is 4.53% and, consistent with this positive average, there are more positive than negative years. But the shorter-term volatility of the premium is evident in the randomness of the years along the horizontal axis. Looking at a recent sequence of years highlights this. While 2020 was the worst year for value vs. growth, at -39%, the value premium bounced back with 13% and 29% returns in 2021 and 2022.
See also: Dimensional rolls out sustainability targeted value fund | Portfolio Adviser
Annual Value Premiums of the US market, 1927-2022
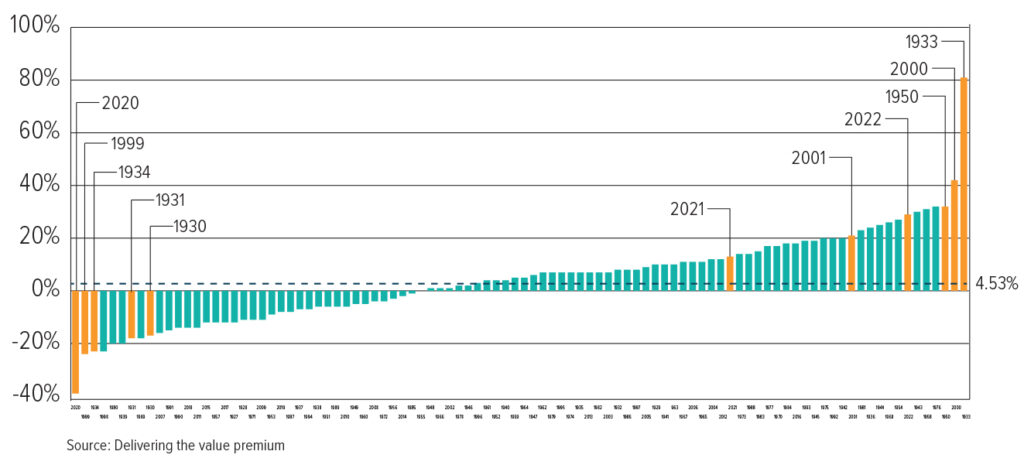
Source: CRSP and Compustat data calculated by Dimensional.
If you drill deeper into these numbers, looking at the months within the year, the volatility becomes even more apparent. That’s what we’re showing in this second chart. It also shows the annual value premiums ranked from worst to best, but highlights, for each year, the best and worst months as well as all those in between.
Monthly Value Premiums of the US market, 1927 – 2022
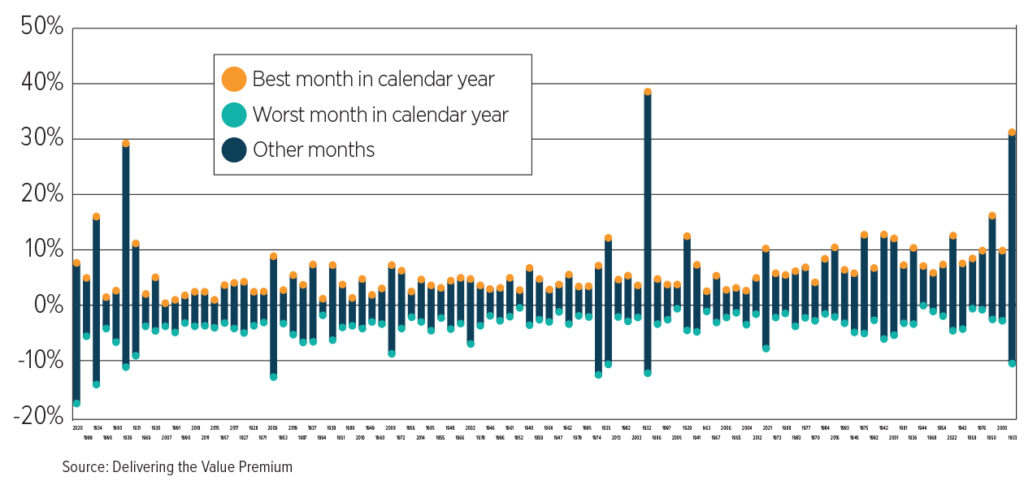
Source: CRSP and Compustat data calculated by Dimensional
You can see that the worst year for value, 2020, had several months where it nonetheless outperformed growth. In fact, there was a single month with a nearly 10% value premium. Equally, in the best year for value, 1933, there where a couple of bad months. All years, whether good or bad for the value premium, are made up of a combination of positive and negative months.
This illustrates the nightmarish scenario faced by anyone looking to time the value premium. Missing out on a few of those good months, even during an overall negative year, is a big opportunity cost. The better approach is to set yourself up to capture the long-term average value premium, which both theory and evidence suggest is positive, without the stress and risk of changing lanes to get ahead.
See also: Is the property market really as safe as houses?
Our confidence in the value premium is based on a simple principle. All else equal, the less you pay for the same expected future cashflows, the higher your expected return. This is why value stocks should be expected to outperform growth stocks, especially when comparing stocks with similar expected cashflows. Evidence from across global markets and going back almost 100 years provides ample support for the reliability of the value premium. That’s strong incentive for investors to maintain a disciplined stance to asset allocation, so they can capture the outperformance when value stocks deliver.
Beyond theory and long-term evidence, another consideration is how quickly the value premium rebounds after a disappointing period. In the US, for example, the first half of 2023 marks just the 10th time since 1926 that value stocks have underperformed growth stocks by more than 20 percentage points over a two-quarter period. Still, more often than not value has responded like the comeback kid: beating growth over the following four quarters in seven of the nine previous instances and averaging a cumulative outperformance of nearly 29 percentage points.
The sample size may be small, but a positive average value premium following a large negative period is not too surprising. In fact, looking at the other side of the value performance distribution, there have been 19 two-quarter periods with the value premium exceeding positive 20%. In 11 of these, value outperformance continued over the next four quarters. The average premium across all 19 was 3.6%.
The same applies more generally to the equity market itself and to other premiums within equities, like those associated with size and profitability. And because these premiums do not move in lockstep, combining them in so-called multifactor solutions can mitigate volatility and increase the probability of meeting your financial goals, thereby giving you a more comfortable ride towards that long-term average.