

Having largely given up on organic intelligence, investors have grown all excited over its artificial offspring. As a result, the (mainly US) stocks linked to AI have raced away from the broad market this year. I’m unsure as to whether those same investors have not seen the Terminator franchise or, having done so, rather like the idea of the future it portrays. But who am I to argue?
What is clear, however, is the narrow base of this rally. My colleague at StarMine, Tajinder Dhillon, did an elegant analysis of this recently, which is summarised below. By the end of May, US large caps had rallied year-to-date by about 9%. Yet, notes Dhillon, this performance has been driven solely by Apple, Microsoft, Nvidia, Amazon, Meta, Tesla and Alphabet, which combined have contributed all the overall index return.
This has seen their weight within the large-cap Russell 1000 index rise to a near all-time high (26.2%) – “well above the long-term average of 15.9% and median of 15.0%”. Apple’s $2.75tn (£2.16tn) market cap alone now exceeds the entire $2.24tn market cap of the small and mid-cap Russell 2000 index.
These are growth stocks, of course, and their return to fortune has reversed last year’s outperformance of value stocks – a phenomenon driven to a large extent by the success of oil & gas companies.
Over the year to 6 June, comparing global, US and UK value and growth indices, growth is storming it, with the large cap Russell 1000 Growth TR up a nudge above 20%, followed by the MSCI World Growth TR at 16.9%.
The FTSE UK Growth index is in third place, albeit lagging with a 7.8% total return. Meanwhile, the value indices are in negative territory – except for FTSE UK Value, which posted a 3.3% return.
It’s instructive to see how this plays out across cap and style tilts over the broad piste of Lipper’s Equity Global classification. Shamelessly plugging our own capabilities, style and cap classifications have been available for US funds for a long time, but we are now rolling out this capacity globally, while enhancing the methodology. So, I have taken the new functionality for a spin through the classification.
A question of style
Lipper’s new Global Holdings Based Classification breaks fund equity allocations down into geography, style and market cap. It provides a transparent quantitative model that can be applied consistently across global markets, providing dynamic peer groupings for performance, risk, and overall comparisons. This can be used to create peer groups and to help explain performance within a broader sector – which I have done with the Lipper Global Equity fund classification from 2020 on in Table 1 below. The results are ordered by year-to-date returns in descending order.
Table 1: Equity Global Fund Returns by Holdings Based Classification, 2020 to Year-to-Date (%)
| Global Holdings Based Classification | 2020 | 2021 | 2022 | Year to 6 June 2023 |
| Equity United States Multi-Cap Growth | 26.94 | 12.9 | -25.11 | 10.41 |
| Equity United States Large-Cap Growth | 19.4 | 21 | -16 | 9.44 |
| Equity United States Large-Cap Core | 14.34 | 22.72 | -8.88 | 8.11 |
| Equity Global Large-Cap Growth | 25.54 | 17.91 | -16.77 | 8.02 |
| Equity Global Large-Cap Core | 13.46 | 20.07 | -9.45 | 5.25 |
| Equity Global Multi-Cap Growth | 27.34 | 13.76 | -18.9 | 4.12 |
| Equity Global Multi-Cap Core | 14.57 | 17.46 | -10.28 | 3.08 |
| Equity Global Mid-Cap Growth | 25.45 | 20.95 | -15.84 | 2.08 |
| Equity Global Multi-Cap Value | 3.18 | 18.61 | -1.58 | 0.63 |
| Equity Global Mid-Cap Core | 8.13 | 12.35 | -12.78 | -1.86 |
| Equity Global Mid-Cap Value | -4.08 | 27.74 | 16.79 | -3.6 |
Source: LSEG Lipper
The leading three classifications all have the geographic identifier of US – in that more than 50% of their holdings are US stocks. That is not particularly surprising as more than 60% of the MSCI ACWI index consists of the US – meaning it is quite easy for a fund to be underweight US stocks when benchmarked to this index and still have a determinant US tilt. What is also not particularly surprising is that, given the role of the US tech leviathans this year, this geography outperforms.
The leading classification is multi-cap rather than large-cap but there are just 14 primary share classes in this group, and the strongest performer has a strong IT exposure (58.9%), with many familiar tech beasts in the portfolio, which pulls the average return up by a significant degree. So sector exposure, only partly captured by the model, characterises the top-returning classification year-to-date. The opposite is also true, with value and mid-caps underperforming. Overall, 2023’s equity global fund returns conform to the current market narrative, with outperformance driven by US large-cap tech.
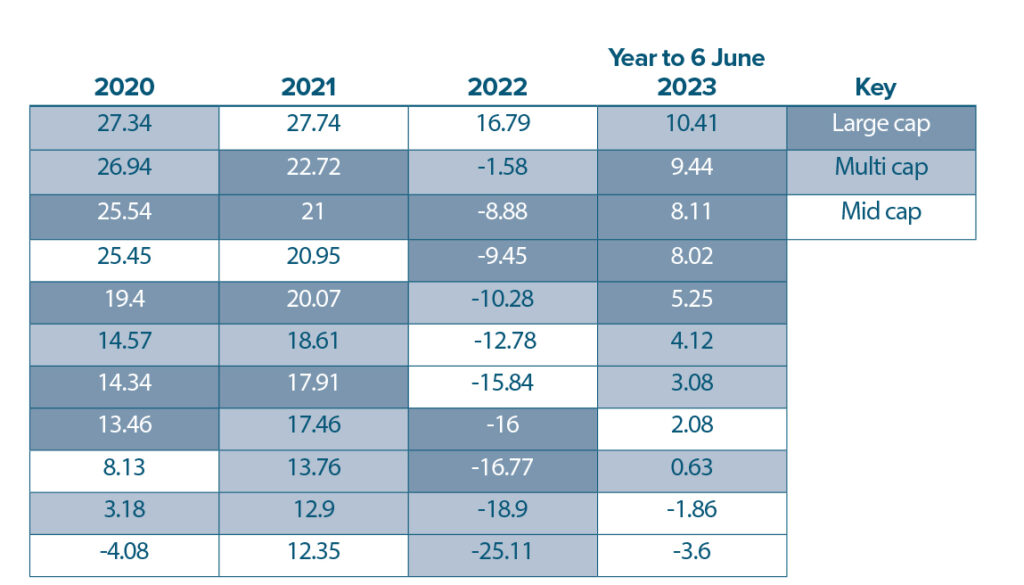
To better see cap and style effects over the period, I next sorted funds by cap bias in Table 2, with each period ranked from highest return to lowest. While there is a clear bias to large cap year-to-date, the picture is far more mixed in the three previous full years.
Table 2: Equity Global Fund Returns Sorted According to Cap Size, 2020 to Year-to-Date (%)
Source: LSEG Lipper
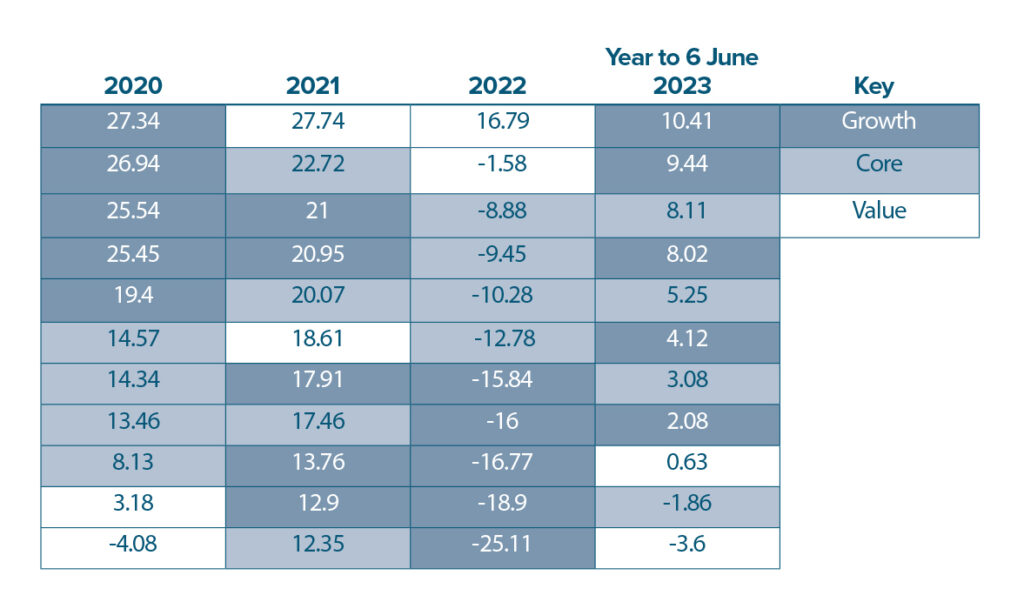
There is a clearer picture when ranking by style, as we do in Table 3. Overall, as you would expect, value underperforms and growth outperforms, year to date. The clearest contrast, however, is between 2020 and 2022: in the former, the top five styles are all growth, then comes core – no distinct style bias – and then value. In 2022, when oil & gas was the top-performing equity sector, that picture is entirely reversed.
Table 3: Equity Global Fund Returns Sorted According to Style, 2020 to Year-to-Date (%)
Source: LSEG Lipper
Growth, but for how long?
So much for history. While these sorts of analytics have a valuable role in gauging the potential impact of macroeconomic shifts, as the saying variously attributed to physicist Niels Bohr and baseball player Yogi Berra has it: “It’s difficult to make predictions, especially about the future.”
In this instance, the $64m question (and the rest) hinges on – is this growth/tech rally sustainable, and if so for how long? To help answer this, let’s return to Dhillon’s piece, where he argues the market has priced in very high growth expectations, with a positive five-year compounded annual growth rate of 50.2% for current market darling Nvidia.
To be clear, this is the percentage amounts earnings per share would have to increase by each year, for the next five years, to justify the current price. This, Dhillon notes, is well above the industry average of 6.9%, suggesting that a company such as Nvidia “is currently a ‘high-expectation’ stock leaving it minimal wiggle-room for disappointment”.
I would argue further that, while the cyclically-adjusted P/E ratio of the S&P 500 fell substantially last year, it is still well above its historic average, so US stocks – not least those driving the rally – are not cheap. And, finally, the current high-rate environment has proven persistent – well beyond the expectations of central bankers.
The longer this lasts, the greater the headwind for growth stocks relative to value. It may well be that it will take a full-blown recession to bring rates back down, in which case equities in general will struggle, and richly valued growth stocks more so.
While, as the adage goes, the market can remain irrational longer than you can remain solvent – Apple, for instance, has gone up and up beyond the expectations of most analysts historically – this growth rally seems thinly supported. At the very least, a lens that gives an insight into portfolios’ style, cap and geographical exposures is an invaluable tool in navigating these risks.
It certainly beats running your portfolio through ChatGPT.
Dewi John is head of research UK & Ireland at Refinitiv Lipper