Outside of hermits and epidemiologists, perhaps, few people could convincingly claim 2020 proved to be a good year for them but it certainly turned out to be a good year for environment, social and governance (ESG) oriented funds in the UK.
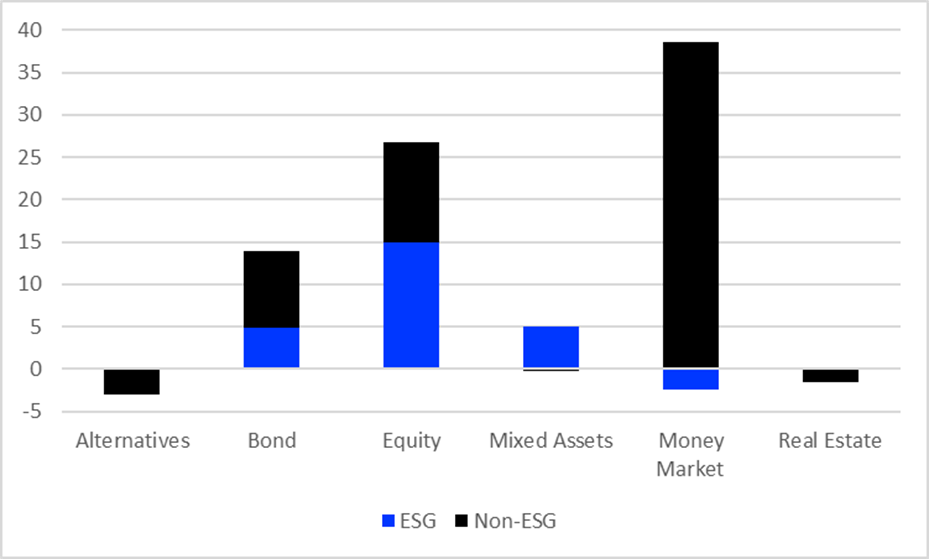
As Chart 1 shows below, ESG dominated fund flows in mixed assets. Over the year, net ESG assets in this area totalled £4.94bn, while non-ESG assets saw outflows of £235m. Sustainable equity funds also made a strong showing, taking in the most assets (£14.93bn) compared with £11.8bn for non-ESG equivalents. And, while ESG has not acquired the dominant position in bond flows we can see in equities, it is taking an increasing market share – £ 4.84bn versus £9.03bn for non-ESG funds.
Chart 1: ESG and Non-ESG Net Asset Class Flows 2020 (£bn)

Source: Refinitiv Lipper
The rewards of virtue
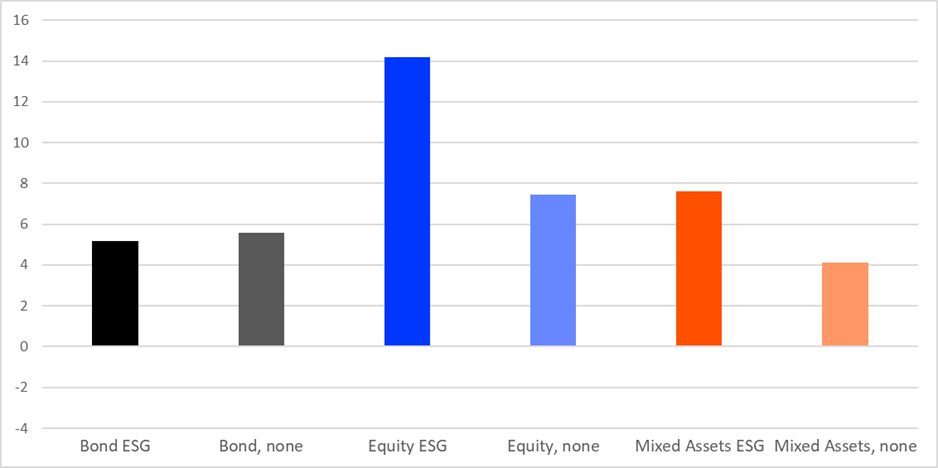
So were these strong ESG flows rewarded with more resilient performance over the year? To help determine this, Chart 2 below sets out the bond, equity and mixed asset returns across the UK fund universe for 2020.
ESG funds in both equity and mixed assets outperformed significantly (14.2% versus 7.4% for equity; 7.7% v 4.1% for mixed assets), while non-ESG bond funds outperformed their ESG peers, albeit by a smaller margin of 40 basis points (bps).
Chart 2: Asset Class Returns, ESG v non-ESG 2020 (%)

Source: Refinitiv Lipper
More observant readers will have picked up on the fact 2020 did not offer an entirely smooth run through the year so it is worth looking at quarterly performance to obtain a better view of how funds fared in both rising and falling markets.
As markets plummeted in the first quarter of 2020, ESG funds fell less for bond, equity and mixed assets. The difference was smallest for bonds (38 bps) and greatest for equities (3.7 percentage points). The mixed assets gap was closer to equities than bonds, at 3.1 percentage points. Then, when markets rallied in the second quarter, ESG equity funds recovered more than their non-ESG peers (1.13 percentage points), indicating the first-quarter outperformance was not because ESG funds tended to have a lower market sensitivity.
Turning to global figures momentarily, the performance differential within equities persists for the asset class – albeit by a smaller margin. Last April, Refinitiv Lipper looked at how equity funds globally had fared over the downturn, split between conventional (31,567) and ESG (2,773) funds. Most conventional funds (17,750) underperformed their respective technical indicators, while the majority of ESG funds (1,497) outperformed.
This ESG advantage persisted over the full year, as actively managed ESG funds outperformed their technical indicators by an average of 3.31%, compared with 1.19% for conventional funds. What is more, the general percentage of funds that outperformed their technical indicator was higher for ESG-related funds (59.15%) than conventional funds (49.52%). That said, ESG funds also showed a greater underperformance (-8.66%) compared with their conventional peers (-8.24%).
More than an equity effect
Given ESG bond funds’ overall underperformance, is ESG outperformance solely an equity effect? A provisional check on this can be done by comparing the 2020 returns of Mixed Asset sectors that are distinguished by their relative equity/bond mix – as represented by the Mixed Asset GBP Aggressive (65-100% equities), Balanced (35-65% equities), and Conservative (0-35% equities) Lipper Global Classifications in the following table.
2020 returns of Mixed Asset sectors – ESG v non-ESG
| Classification | ESG (%) | Non-ESG (%) |
| Mixed Asset GBP Aggressive | 10.5 | 4.5 |
| Mixed Asset GBP Balanced | 6.8 | 2.9 |
| Mixed Asset GBP Conservative | 8.0 | 3.4 |
Source: Refinitiv Lipper
As the degree of Conservative outperformance is greater than for Balanced Mixed Asset funds, it is likely that 2020’s ESG outperformance is attributable to more than just the kicker effect of equities – although determining exactly what that would be is another matter.
Style effects
One potential factor is that some non-ESG funds have been impacted significantly by negative oil prices while, conversely, exposure to new economy growth stocks – with their lower carbon footprint and, almost by default, higher ESG scores – provided a tailwind for much of the year. Although, of course, you do not need to be an ESG fund to have a portfolio chock full of Tesla and Facebook, these exposures would have militated broadly in favour of ESG funds.
Another related issue that points to outperformance from contingent factors is that the only quarter where non-ESG equity funds outperformed their ESG peers was the fourth, where they delivered an additional 1.46 percentage points. This coincides with a strong rally in value stocks from the start of November. Funds with higher allocations to energy stocks will have benefited from this.
Overall, then, ESG equity and mixed-assets funds outperformed their conventional equivalents over the year. This was in part due to their lack of energy exposure, which may be reversed with a change in the dominant market style. That said, the oversight processes of ESG funds are not necessarily the ones tested in the pandemic – particularly environment and governance.
While it is difficult to reach any definitive conclusions on the reasons for such outperformance, it certainly has not dented the overall ESG investment thesis. And investors in the outperforming funds can happily pocket the excess return, whatever its provenance.
Dewi John is head of research UK & Ireland at Refinitiv Lipper


