

Oscillations between value and growth can provide those hand-waving explanations that actually do not explain very much. Value is outperforming now where growth was before because… well, just because.
That said, the individual elements of what is producing these high-order effects can tell us a lot more than a heavily generalised summation – as can how this is mediated through specific portfolios.
As an example, a recent blog from benchmark provider FTSE Russell, entitled Commodity boom gives value the edge in Q1 maelstrom, notes that the ‘value’ and ‘dividend yield’ factors have strongly outperformed the growth-focused ‘quality’ factor over the first quarter of this year, as Chart 1 illustrates.
Chart 1: Factor relative returns (%) – Q1 2022
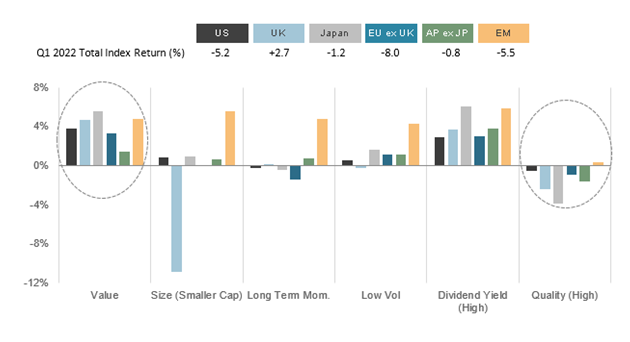
Source: FTSE Russell, to 31/03/22. Note: The value active industry weights are based on the FTSE Global Equity Index Series (GEIS), with the UK represented by the FTSE UK, the US by the FTSE USA and Europe by the FTSE Developed Europe ex UK
This has been driven by two factors, the first being that value stocks tend to belong to outperforming sectors such as oil & gas, miners and consumer staples. These have benefitted hugely from supply chain disruptions – whether from the disjointed post-Covid not-so-normal ‘normalisation’ or war in Ukraine.
Second, rising interest rates favour value stocks relative to their growth counterparts, as the former are shorter-duration and therefore suffer less from the discounted value of future earnings – unlike, say, the tech sector, where companies often have valuations premised on earnings with a strong emphasis on the word ‘future’.
In turn, these two factors have combined over recent months to catalyse a third – the dumping of expensive new economy stocks, the valuations of which have ballooned during the low interest rate environment that has persisted since the global financial crisis.
OK for UK
The UK has been a particular beneficiary of this, outperforming many other equity indices over the year thus far. The FTSE 100’s oil & gas weight is about 12%, for example, as compared with the S&P 500’s 4.4% in the US and nothing for the Dax in Germany.
Indeed, as Chart 2 shows, energy, basic materials and consumer staples make up nearly 40% of the FTSE All-Share index.
That said, the performance you actually see will depend very much on where you are on the market-capitalisation scale, as the mid-cap FTSE 250 has only about 2% in oil & gas and has performed in lockstep with Germany’s Dax so far this year.
Chart 2: Value active industry weights (%)
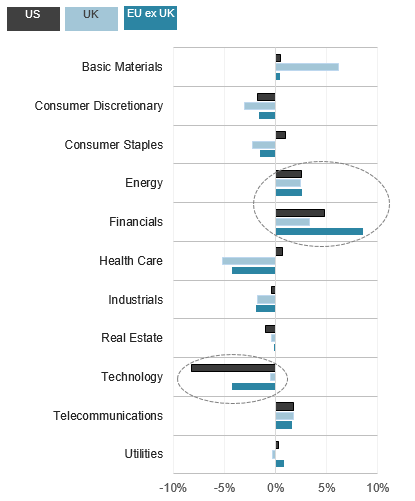
Source: FTSE Russell, as at 31/03/22. Note: The value active industry weights are based on the FTSE Global Equity Index Series (GEIS), with the UK represented by the FTSE UK, the US by the FTSE USA and Europe by the FTSE Developed Europe ex UK
What the UK large-cap index lacks has served it almost as much as what it has, as there are no home-grown equivalents of the FAANG stocks in the US, or their ‘BAT’ counterparts of Baidu, Alibaba and Tencent in China. That, of course, hurt the FTSE until the tail-end of 2020, since when it has been a boon.
Style exposure is not necessarily a straightforward effect, however – hence my scepticism about generalised comments over value and growth effects. Take, for example, financials, which have a heavy value tilt. As a result, they suffered smaller losses than the broad market in the US and Europe and rose in line with the benchmark in the UK.
Banks do well as rates rise, as higher rates allow for higher margins. That said, they are also heavily procyclical. So, as recessionary fears grow, and UK GDP fell over the course of the first quarter, the shine has come off this sector, banks have sold off and valuations suffered.
Nevertheless – and please excuse my generalisation, having slated such an approach – in the round value has outperformed since the ‘vaccine rally’ kicked in, in November 2020, as Chart 3 illustrates.
Chart 3: US and UK Value v Growth Indices
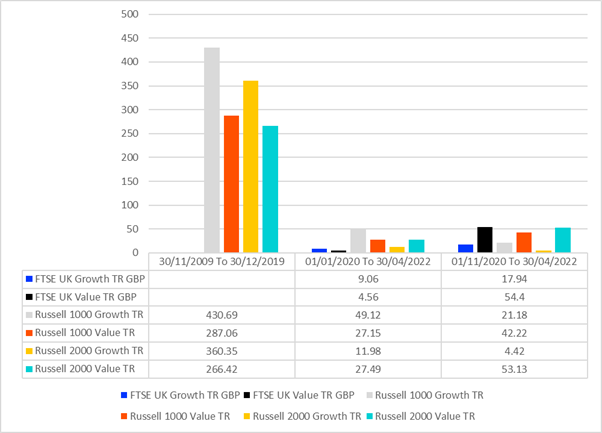
Source: Refinitiv Lipper, to 30/04/22
While the FTSE UK Growth and Value indices’ history does not stretch back to 2009, you can clearly see the effect with the US large-cap Russell 1000 and small-cap Russell 2000 indices. The growth premium until the end of 2019 was considerable – particularly among large caps. For more than a decade, you could not put a foot wrong throwing your money at big tech beasts such as Amazon or Facebook.
Things are more mixed from the start of 2020 to April 2022, with UK growth and US large-cap growth still outperforming, while value edged it elsewhere.
From November 2020, however, when global markets bounced hard on expectation of a viable vaccine rollout, the trend is much clearer: as Chart 3 also shows, it has been value all the way, by a massive degree – of almost 50 percentage points, in the case of US small-caps. And the highest return has been from UK value.
Fund-level view
An interesting exercise has been to see how this index performance panned out for UK equity funds, taking the two periods – up to the end of 2019 and from November 2020 – from Chart 3 and applying them to Lipper’s Equity UK group of funds.
Unsurprisingly, over the first 10-year period, the top of the table is dominated by growth funds and the bottom value – though there are exceptions. Returns ran from 422% to -19%, meaning the top-performing growth-oriented UK fund still lagged the 430% return of the US large-cap growth index, the Russell 1000 Growth.
From November 2020, there is a complete style reversal. Returns run from 76% to -12% over the period, with a general pattern running from value to growth – though, again, not without exceptions.
The three top-performing funds between 2009 and 2019 rank 146th, 170th and 220th out of 257 from November 2020.
Conversely, the top three performers since November 2020 with histories stretching back far enough ranked 96th, 63rd and 41st out of a universe of 164 funds.
What this final – and, admittedly, back-of-an-envelope – calculation indicates is that while style matters, so too does manager skill. The top-performing UK equity manager between November 2020 and April 2022 still beat the FTSE UK Value index by 76.2% to 54.4%, while the top-performing fund over 2009 to 2019 has nevertheless managed to deliver 32.2% – almost double that of the UK Growth index over the same period.
Mind you, the best UK manager did not beat the index for US large-cap growth over a decade, underling the importance of calling the prevalent macro drivers and knowing what markets to place your bets in – though, as ever, that is easier in hindsight than while, as now, sitting in your foxhole as it all goes off around you.
And of course, if you misjudge the former, identifying a manager able to adapt, even when those drivers are against them, can help a lot.
Dewi John is head of research UK & Ireland at Refinitiv Lipper