

There has been a strong disconnect between the FTSE 100 and FTSE 250 indices since the start of the year. The FTSE 100 is a developed market top-performer whereas, as Chart 1 illustrates below, the showing of its mid-cap sibling is in line with the much less impressive performance of European large-cap stocks.
Chart 1: European, UK and US indices’ performance
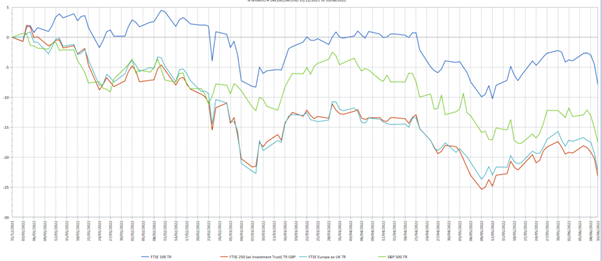
Source: Refinitiv Lipper. Year to 10/06/22
I have scratched my head as to why European stocks – predominantly large caps – and UK mids might have marched in lockstep over the year and do not have an answer – the composition of each is quite different, for example.
By all means, drop me a postcard if you can explain it but, for now, I am filing it under ‘just one of those things’.
Open for business?
Let’s take a quick detour from the FTSE 250 itself to look at the UK economy more broadly.
The UK’s growth prospects are highly relevant to the mid-cap index, as it has far more UK exposure than the FTSE 100, so is more sensitive to what goes on in the domestic economy. Indeed, to a large degree, it is the domestic economy.
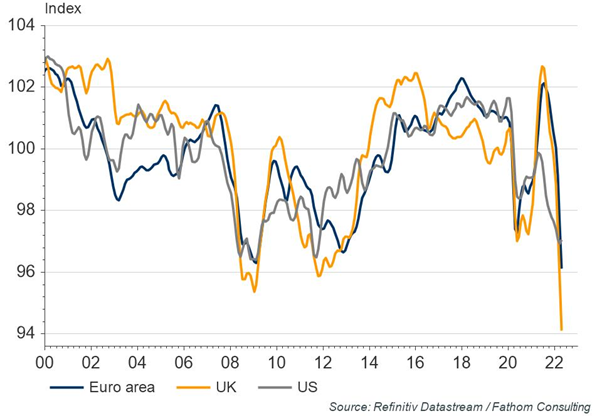
First, the bad news: as Chart 2 shows, consumer confidence is falling faster in the UK than for its OECD peers, with growth predicted to be worse than all other OECD members apart from Russia.
The unfolding trade dispute with the European Union over the Northern Ireland protocol is unlikely to brighten this picture.
Chart 2: Developed market consumer confidence
There is, however, some longer-term good news – though, as we will see, this is heavily skewed to large cap.
In some respects, the UK looks like a good place for business. The UK is an innovative country, ranking fourth in the World Intellectual Property Organisation’s latest Global Innovation index, ahead of many European peers – and, while other methodologies score the UK lower, this is probably the most authoritative.
Yet even this comes with a heavy caveat, highlighted by the then Bank of England chief economist well before Covid-19 hit.
Exactly four years ago, Andy Haldane complained there was no mechanism for the transmission of productivity for all but the largest UK companies.
“When it comes to innovation, the UK is a hub without spokes,” he argued – the ‘hub’ being the heavy innovators, and the ‘spokes’ the channels through which innovation spreads.
“Since 2008, productivity in the UK has essentially flat-lined,” Haldane added.
Even back then, he was of the opinion: “This is almost unprecedented in the modern era – a ‘lost decade’ and counting. The UK faces perhaps no greater challenge, economically and socially, than its productivity challenge.”
Indeed, the UK has been a laggard since at least the global financial crisis. As the Office for National Statistics has pointed out, the UK saw the largest proportional fall in the level of gross fixed capital formation (GFCF) of any G7 nation after the pre-financial crisis peak of the first three months of 2008, falling by 18% from peak-to-trough.
Furthermore, between the first quarter of 1997 and the second quarter of 2017, the UK had the lowest average GFCF as a percentage of GDP of any OECD nation.
In other words, the structural issues that Haldane pointed to four years ago have led to persistent lower growth – something unlikely to end while those structural issues are themselves not remedied.
Beyond Covid
Largely in response to Covid, the government has injected almost £1trn into the economy – more than any other UK government at any other time. That, as an economist I used to work with never tired of saying, is a good night out by anyone’s estimate.
Yet this has not acted to stimulate production above its sub-par trend – if anything, things have deteriorated since Haldane’s 2018 comments, with investment and productivity growth anaemic.
At the end of the second quarter of 2021, the Bank of England noted: “Over recent years, business investment in the UK has been weak.”
Although it expected a recovery in investment post-Covid, this has not materialised. So, with a recession looking increasingly likely, UK growth anaemic if not negative, and its consumers not even on life support but languishing in the hospital corridor on a gurney, those companies with strong domestic exposure – in relative terms, mid caps – do not look a particularly rosy prospect.
Sector selection
There is a stronger trade-off between inflation and employment in less open economies than their more open peers. With April’s consumer price index inflation standing at 7.8%, these effects are exacerbated.
The UK has become less open since Brexit – especially those businesses that started with a greater domestic focus, which tends to mean those below the FTSE 100.
The composition of the FTSE 250 index – excluding investment trusts – is set out in Chart 3 below.
Chart 3: FTSE 250 ex-IT constituents
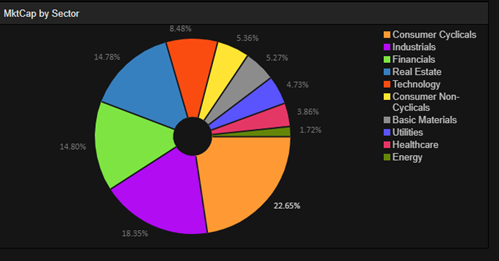
Source: Refinitiv Workspace
The extent to which companies can control costs or pass on cost rises is therefore a question with increasing bottom-line impact. Taking a snapshot of some of the biggest stocks in the three largest sectors:
Consumer cyclicals (22.7% of the index): Bellway is down about 35% year-to-date; M&S is down 42%; Inchcape is down 27%, and Travis Perkins is down 35%: all with big exposure to UK consumer.
Industrials (18.4%): Engineer Weir Group is down 16% (with growing short interest noted); EasyJet is down 30%.
Financials (14.8%): This FTSE 250 sector is dominated by insurers and asset and wealth managers, rather than the large banks in the FTSE 100. With profit margins that expand as rates climb, these operations generally benefit from higher rates.
Insurance disrupters are burning cash at an alarming rate, so this is perhaps good for the traditional incumbents that inhabit the FTSE 250.
Another point worth noting is that dividend-reliant stocks do comparatively well in a rising-rate environment. FTSE 100 companies are expected to pay out about £80bn of a slated £90bn UK total this year.
Most of the rest, unsurprisingly, will come from the FTSE 250 – however, it is not all about blue-chip cash cows.
At the end of April, the dividend yield on the FTSE 250 was about one percentage point lower than for the FTSE 100 – however, a number of FTSE 250 companies pay out in the high single-digits, particularly financial services companies.
So, while UK mid caps overall may be getting hammered, with little sign of respite, financials with robust dividend streams look to be an interesting part of the index.
Bad year for active managers
At the fund level, the biggest losers over the first five months of year have been those with the largest tilt to consumer services. Those suffering the smallest falls – none are in the black over the period – have meanwhile been tilted towards industrials and financials.
Only two actively-managed funds with more than 80% in mid caps had beaten the index over the first five months of the year, with some losing as much as 28%, compared with trackers’ losses of just above 12%.
Despite this disparity, passive funds with the FTSE 250 as a benchmark have seen outflows of £763m over the year so far, while their active peers have suffered just £474m of negative flows.
Dewi John is head of research UK & Ireland at Refinitiv Lipper