

After a lengthy period in investment purgatory, are UK equities on the road to redemption? This is the question my StarMine colleague Tajinder Dhillon addresses in this excellent analysis, where he argues the case for the asset class from a valuation and dividend perspective. It is well worth reading in full but, for those of a more ‘TL:DR’ disposition, let’s address some of the points.
UK equities lagged other developed markets over the past decade or so until late 2020. The FTSE All-Share had a compound annualised growth rate (CAGR) of 4.7% and 7.3% over the last five and 10 years, respectively, compared with the Russell 1000’s CAGR of 16.5% and 14.9%, and a DataStream World Market CAGR of 11.1% and 9.9% over the same periods.
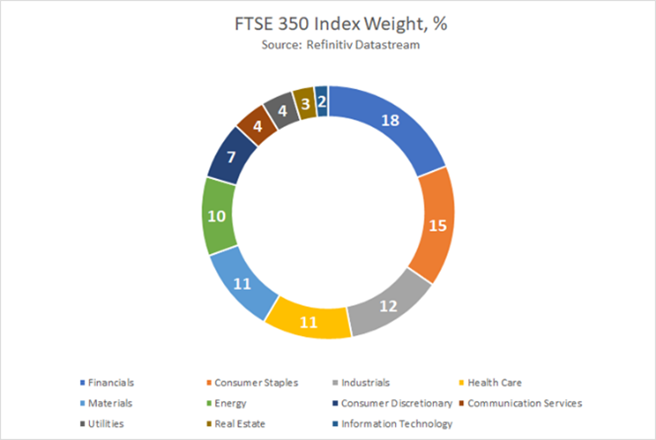
The character of the different equity markets has played a significant role in this – the UK being light on the large-cap tech that has been leading the charge since the financial crisis. On the other hand, as the following charts illustrate, UK relative overweights include financials, at 18.5% of the FTSE 350, as compared with about 12% for the Russell 1000, and energy, at 10.2% compared with 3.7% for the Russell 1000.

The UK has, however, been one of the stronger equity markets year-to-date – for example, the FTSE 100 gained 3.1% in local currency terms compared with a decline of 4.7% for the STOXX 600 index. It is also attractively valued: the forward price/earnings ratio (P/E) for the FTSE 350 is 11.5x – 14.2% below its 10-year average of 13.4x – while the STOXX 600 and S&P/TSX are trading at 14.1x and 13.3x, respectively. Despite recent heavy falls, the Russell 1000 index is trading at a forward P/E of 19.2x – a 67% premium to the FTSE 350.
Fund perspectives
It is possible to see how this is playing out at the fund level by looking at the table below, which shows the performance of some of the most significant Lipper Global Classifications for Western developed equities. Over 10 and three years, the US leads, followed by US small and mid-cap, and then even US income.
Selected fund sectors – total return growth and fund flows
| Lipper Global Classification | (%) year-to-date | (%) 12 months | (%) 3 years | (%) 5 years | (%) 10 years | Net flows 12 months (£m) |
| Equity Europe ex UK | -7.63 | 4.63 | 32.64 | 38.82 | 152.60 | -2343 |
| Equity Europe Sm&Mid Cap | -13.49 | 1.17 | 40.18 | 53.87 | 213.14 | 65 |
| Equity Global | -4.61 | 8.18 | 37.90 | 50.70 | 167.43 | 17109 |
| Equity Global Sm&Mid Cap | -9.72 | 1.00 | 34.65 | 60.83 | 230.57 | 615 |
| Equity UK | -3.51 | 6.66 | 15.95 | 22.15 | 98.98 | -9581 |
| Equity UK Income | -0.35 | 9.85 | 13.55 | 16.55 | 92.23 | -6178 |
| Equity UK Sm&Mid Cap | -12.77 | -2.51 | 30.32 | 42.56 | 177.59 | -2851 |
| Equity US | -2.91 | 16.28 | 59.88 | 85.12 | 300.54 | -4261 |
| Equity US Income | 1.93 | 19.66 | 51.74 | 59.03 | 234.62 | 522 |
| Equity US Sm&Mid Cap | -5.58 | 1.08 | 46.37 | 62.73 | 232.00 | -400 |
Source: Refinitiv Lipper. Note: All time periods are to 31/03/22
Dig into the portfolios and you can see that new economy stocks drove this. It is a similar story over five years, but with the small cap factor playing a larger role, as ‘Global Smid ‘makes it into third place. Conversely, the UK – whether large or small cap or income – exhibits the same buoyant performance as a breezeblock in a swimming pool.
It is a rather different story over the first three months of 2020, where Equity UK Income comes in second (-0.35%) and Equity UK fourth (-3.51%), demonstrating this shift in factor leadership. And last year, Equity UK funds returned an average 17.4% – a few basis points ahead of Equity Europe ex UK, although well behind Equity US’s 24.4%.
That said, of course, hardly anyone gets the average return, and Equity UK fund returns year-to-date range from 9.3% to negative 21.6%. The top-performing Equity UK fund is Invesco UK Equity and its dominant sector exposures tell the tale of what is driving market performance now: financials, 16.7%; utilities, 14%; and oil & gas at 14%, as of end-February.
Perhaps surprisingly, one of the top performers is an ESG fund – the Family Charities Ethical Trust, returning 6.9% over the first quarter. Given the market rotation, that seems quite remarkable … until you take a look at the portfolio. The top stock, at more than 10%, is Shell. Conversely, the sector’s poorest performer is characterised as ‘multi-cap growth’.
It is a similar story just round the corner at Equity UK Income, which has outperformed Equity UK, albeit without the same spread of returns. The top-performing fund is SUTL Cazenove Charity Equity Income, which delivered 7.5% over the first quarter and, here, oil and gas exposure has been moderate, with the fund’s largest exposure being financials (23.1%).
Incoming …
Staying with equity income, Tajinder’s StarMine piece makes the case for UK equities from a dividend perspective. While that holds true over the long term – UK dividends are a large part of total return – equity income managers have had to lean more on other sources of return to make it to the top of the performance tables.
In October 2020, the average yield on the 10 funds that had performed best over 12 months was below that of the FTSE 100. There was a distinct inverse relationship between UK equity income fund dividend level and performance, over both one and three years. That is changing as, while the top 10 over three years still have a lower dividend than the FTSE 100, over 12 months the average is slightly ahead of the index, at 3.92%.
A noteworthy result of this longer-term style drift from yield-hunting is that the second-placed vehicle over three and 12 months is passive – Vanguard FTSE UK Equity Income Index, which has returned 7.2% and 20.1%, respectively. It has a yield of 4.4% – one of the highest in the sector. As an index-tracker, it has not had the luxury of hunting outside its designated territory, something which is now benefitting it.
Investors, however, remain unconvinced, with outflows of £8.2bn from Equity UK Income funds over 2021 – all attributable to domestic investors, as non-UK flows remain flat for the year. That does not seem to have abated as a result of the UK’s more resilient start to 2022, and global outflows from Equity UK were £2.8bn, and £575m for Equity UK Income.
UK investors also dumped £9.8bn-worth of Equity UK funds over 2021, and £2.8bn for the first two months of 2022 alone. There may be one glimmer of light, however, as total global flows to the classification were negative £8.7bn, indicating international investors are starting to up their allocations.
Can the good times roll?
In performance terms, this is not a tale of rising national tides lifting all boats, irrespective of size. As you can see from the table above, smallcaps are being hit relative to their larger peers irrespective of location, with the UK’s small and midcaps suffering the second-worst losses in 2022.
What is more, for all the fanfares over the return of value and the demise of tech – and here Mark Twain’s words on premature obituaries come to mind – it is clear the best-performing market over the period is still the US. There is more to the world’s largest stockmarket than the fruits of the loins of Messrs Bezos and Zuckerberg (with apologies for the attendant image).
Still, while we are on these new economy leviathans, from mid-March, Alphabet, Tesla, and Amazon have outperformed the S&P500, clawing back some of their (admittedly leviathan-sized) relative losses – although Netflix and Meta still lag. In the ongoing arm-wrestle between value and growth, it is still far from clear that growth is down and out.
Lastly – and with due acknowledgement that any relationship between national stockmarket returns and GDP is weak at best, and more generally contested – the UK economy is not in the best shape. There is a massive cost of living crisis brewing, with domestic demand likely to be hit. While the UK is one of the most open and international stockmarkets in the world – diluting any effects, particularly for large caps – it is a further factor to consider.
That said, there is now a case to be made for UK equity funds, in a way there has not been for more than a decade. And, despite accumulating evidence, most investors are yet to catch on.
Dewi John is head of research UK & Ireland at Refinitiv Lipper