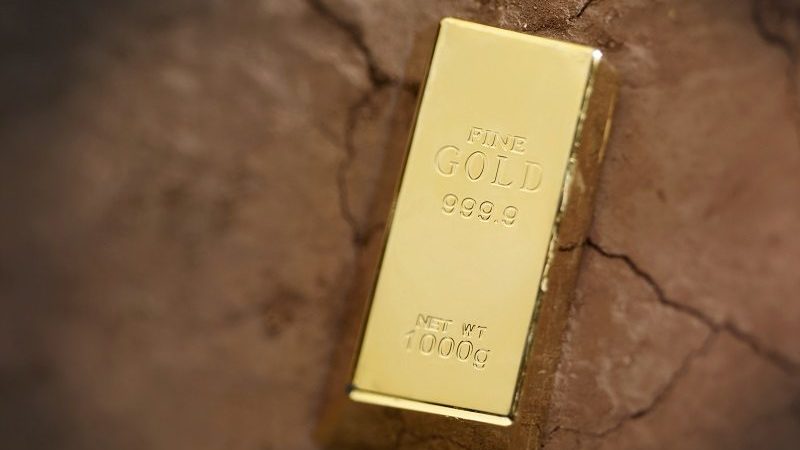
Gold broke through the mythical $2,000 (€1,700) an ounce barrier on 4 August, something that has been long predicted.
But shortly after “suffered its steepest one-day drop since the precious metal’s historic price crash of April 2013”, says Adrian Ash, director of research at marketplace BullionVault.

But that hasn’t stopped the bulls from predicting that the price could hit $3,000 an ounce.
How high can it go?
“Since 1968, when gold was $35 per ounce, the drivers of gold bull markets have fallen into two categories: inflationary and deflationary,” says Joe Foster, portfolio manager for VanEck’s gold funds.
“We don’t see inflation spiking anytime soon, so we believe this to be a deflationary cycle.
“Both recent deflationary gold bull markets suggest that a price over $3,000 per ounce is reasonable.
“In fact, if one measures the start of this bull market from the 2015 lows, then it appears similar to the 2001-2008 bull market when gold rose over 200%.” Foster adds.
See also: Could the gold price really hit $3,000?
The path to $3,000 an ounce is by no means smooth, however.
As VanEck points out, companies engaged in the production and distribution of gold may be adversely affected by a number of changes in world events.
These include political and economic conditions, energy conservation, environmental policies, commodity price volatility, changes in exchange rates, imposition of import controls, increased competition, depletion of resources and labour relations.
“If one believes, as we do, that the current central bank stimulus to fight the impacts of the Covid-19 virus, along with elevated levels of systemic risks, are similar to those during the global financial crisis, then $3,400 may be the target for this bull market,” adds Foster.
Investor response
Looking at the first half of 2020, flows into gold funds worldwide peaked in April at just over $7.1bn, before dropping by nearly half to £4.5bn in June, data from EPFR shows.

Source: EPFR
Compare this with the chart below, outlining European-domiciled gold funds, and it is quite a different story.
January saw the strongest net inflows in over two-and-a-half years, according to Morningstar.
But as lockdowns started to be imposed across the continent in March, the sector saw net outflows of nearly €4bn.
This trend bumbled along for the remainder of H2 before a moderate uptick in July.

Source: Morningstar
Favourable environment?
VanEck chief executive Jan van Eck adds: “Along with the persistence of negative real rates, we believe many dynamics appear very favourable for gold and gold equities moving forward.
“Gold continues to be a scarce commodity, and the fact there have been no significant new gold discoveries since 2016 only adds to its supply pressure.
“Meanwhile, gold mining companies have re-emerged from a period of management turnover and fiscal restructuring and are, in our view, now better positioned to return value to shareholders.”
Outlook
A cursory internet search will throw up articles from nearly 10 years ago that predict gold will break through the $2,000 an ounce barrier.
But, as per the chart below, after reaching around $1,900 an ounce in 2011, the price dropped relatively steadily for the next five years.
It took another four years for investors to regain those ‘losses’.

So, while $3,000 may be possible – it would be prudent to remember how long it took gold to hit $2,000 an ounce and how briefly it has, thus far, stayed above that threshold.
For more insight on continental European investment, please visit www.expertinvestoreurope.com


