

An investor whose adviser had relied on the performance scenarios required in a Key Information Document (KID) at the start of this year may have been unprepared for the speed and extent of the crisis about to unfold. The same may also have been true if the adviser was relying on the past performance of an IA sector to illustrate potential future returns or making simplifying assumptions such as ‘the market recovers within a year’.
All these techniques are used by advisers while, more worryingly, the performance scenario approach required in the KID – which already applies to Packaged Retail Investment and Insurance-Based Products (PRIIPs) – is also expected to be applied to all UCITs funds from the end of 2021. The Covid-19 crisis will shine a light on the use of historically based performance statistics as a guide to potential future risks and returns.
Probabilistic distribution
For fund managers the Summary Risk Indicator (SRI) required in a KID and the associated performance indicators are calculated using five years of historic performance data as the key determinant. While the SRI requires the use of value-at-risk analysis, which takes into account a probabilistic distribution of potential returns and losses, the dispersion of returns during the crisis has shown just how broad a categorisation this is and why it is so challenging to prepare an investor for their investment journey using it.
Reviewing the range of UCITs funds that have their current risk indicator score calculated at 3 (from a maximum range of 7) yields a smorgasbord of 16 IA sectors with well over 200 primary funds, which can be equity, mixed asset or bond-oriented, with the latter even including local currency emerging market debt funds.
‘Unfavourable’ scenario
The situation worsens when reviewing the forward-looking performance scenarios required on a KID. Looking at a popular volatility managed, multi-asset fund with an SRI of 3 out of 7, the ‘Unfavourable’ scenario shows the investor might be expected only to lose 1.48% after four years and should expect to make a positive return over the holding period of seven years of 1.18%.
The ‘Moderate’ and ‘Favourable’ scenarios meanwhile show very persuasive growth figures over these time frames. The industry criticism of this approach is well documented and well deserved. As Deloitte put it prior to the crash: “For many investment funds, the bullish market conditions in the recent years may result in overly optimistic future projections today. Recent trends may be further exaggerated in case they are projected over long investment horizons, as very positive past performance is assumed to continue indefinitely and the potential cyclical nature of the markets is not taken into account”.
Setting expectations
For investment advisers, reliance on historic IA sectors performance to explain potential risks and returns does not work either. The range of outcomes in a single fund sector is often so wide as to be meaningless in terms of expectation setting for a client’s individual portfolio. Chart 1 below shows the dispersion of risk over the last 12 months from funds in the IA Mixed Investment 40-85% shares sector between the highest, median and lowest observed.
Chart 1: Dispersion of risk
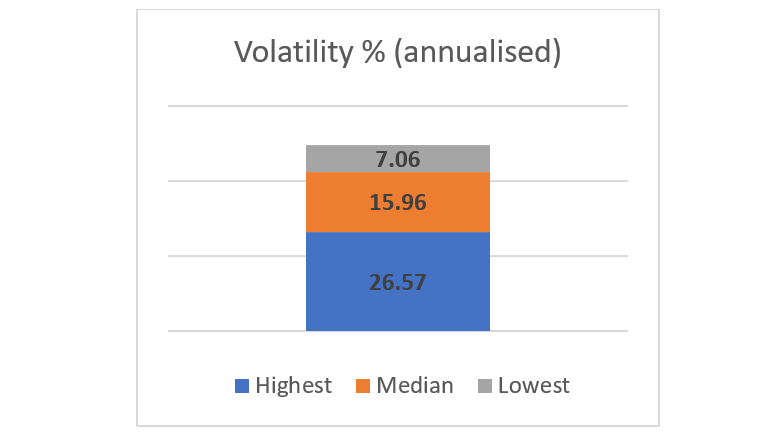
Source: Refinitiv, to 31 July 2020
Assuming a sector’s performance history will continue to repeat itself is of course simply wrong – using this approach in January 2020 would have suggested a crisis of Covid-19’s scale could never have happened.
It goes without saying that relying on deterministic projections to help clients plan for their futures and risk match portfolios has even more limitations, even if combined with ‘market crash’ and recovery assumptions. These crashes also rely in the main on historical events.
The rise in modern asset allocation-driven portfolio construction and financial planning tools reflect the understanding that 90%-plus of the variability of returns of a typical portfolio over time is explained by asset allocation policy (see Financial Analysts Journal, Vol 56, Ibbotson & Kaplan).
Progressive models
The more progressive models use a mix of historical inputs – returns, volatility and asset class correlations – along with inputs reflecting the prevailing conditions, such as inflation, bond yield spreads and forward-looking expectations for global growth and dividend pay-outs. These inputs are fed into an asset model, which assumes a distribution of returns, the extremes of which may not have been experienced yet and can only be seen in ‘tail risk’ events.
Our experience thus far through the pandemic is that this approach provides a much more robust approach for managers and advisers to construct and plan portfolios. Chart 2 below shows the observed performance of the Dynamic Planner MSCI benchmarks over the last year against their expected value at risk (calculated at a 95% confidence limit) and the maximum drawdown experienced.
Chart 2: Value at risk
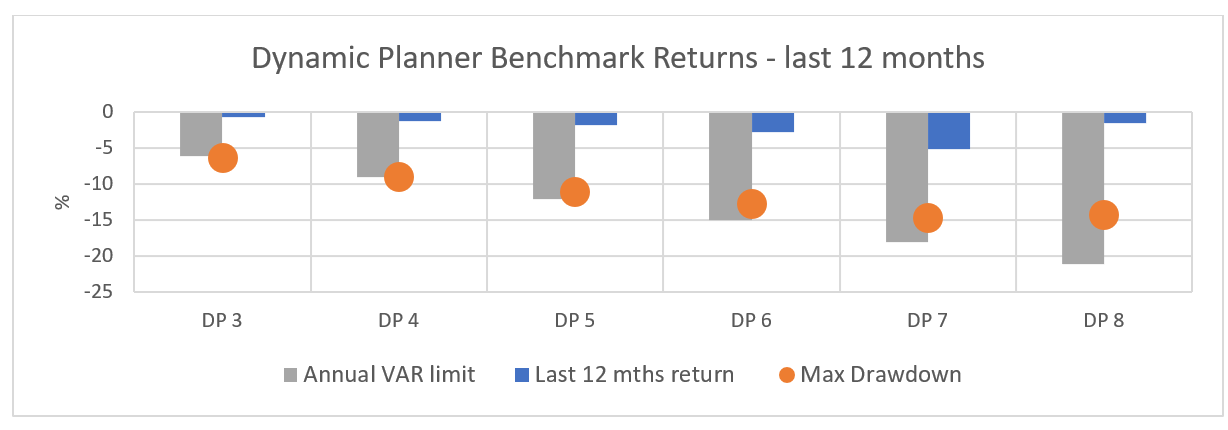
Source: Refinitiv, to 31 July 2020
This value at risk statistic is used with the client during their risk-profiling process so the adviser can be sure it is a consistent basis for matching the portfolio and there is no risk of ‘miscalibration’, as the FCA describes it.
The use of asset allocation-driven, forward-looking models to assess the potential range of returns and losses faced by an investor has been growing rapidly since the great financial crisis of 2008. They represent not just a better mechanism for projecting the future and setting investor expectations but also for then matching to investments that are more likely to perform within these expectations in a way that is fair, clear and not misleading.
They greatly improve on historical or deterministic models from whichever source and mean investors and their advisers should not have to look back in anger.
Ben Goss is CEO of Dynamic Planner